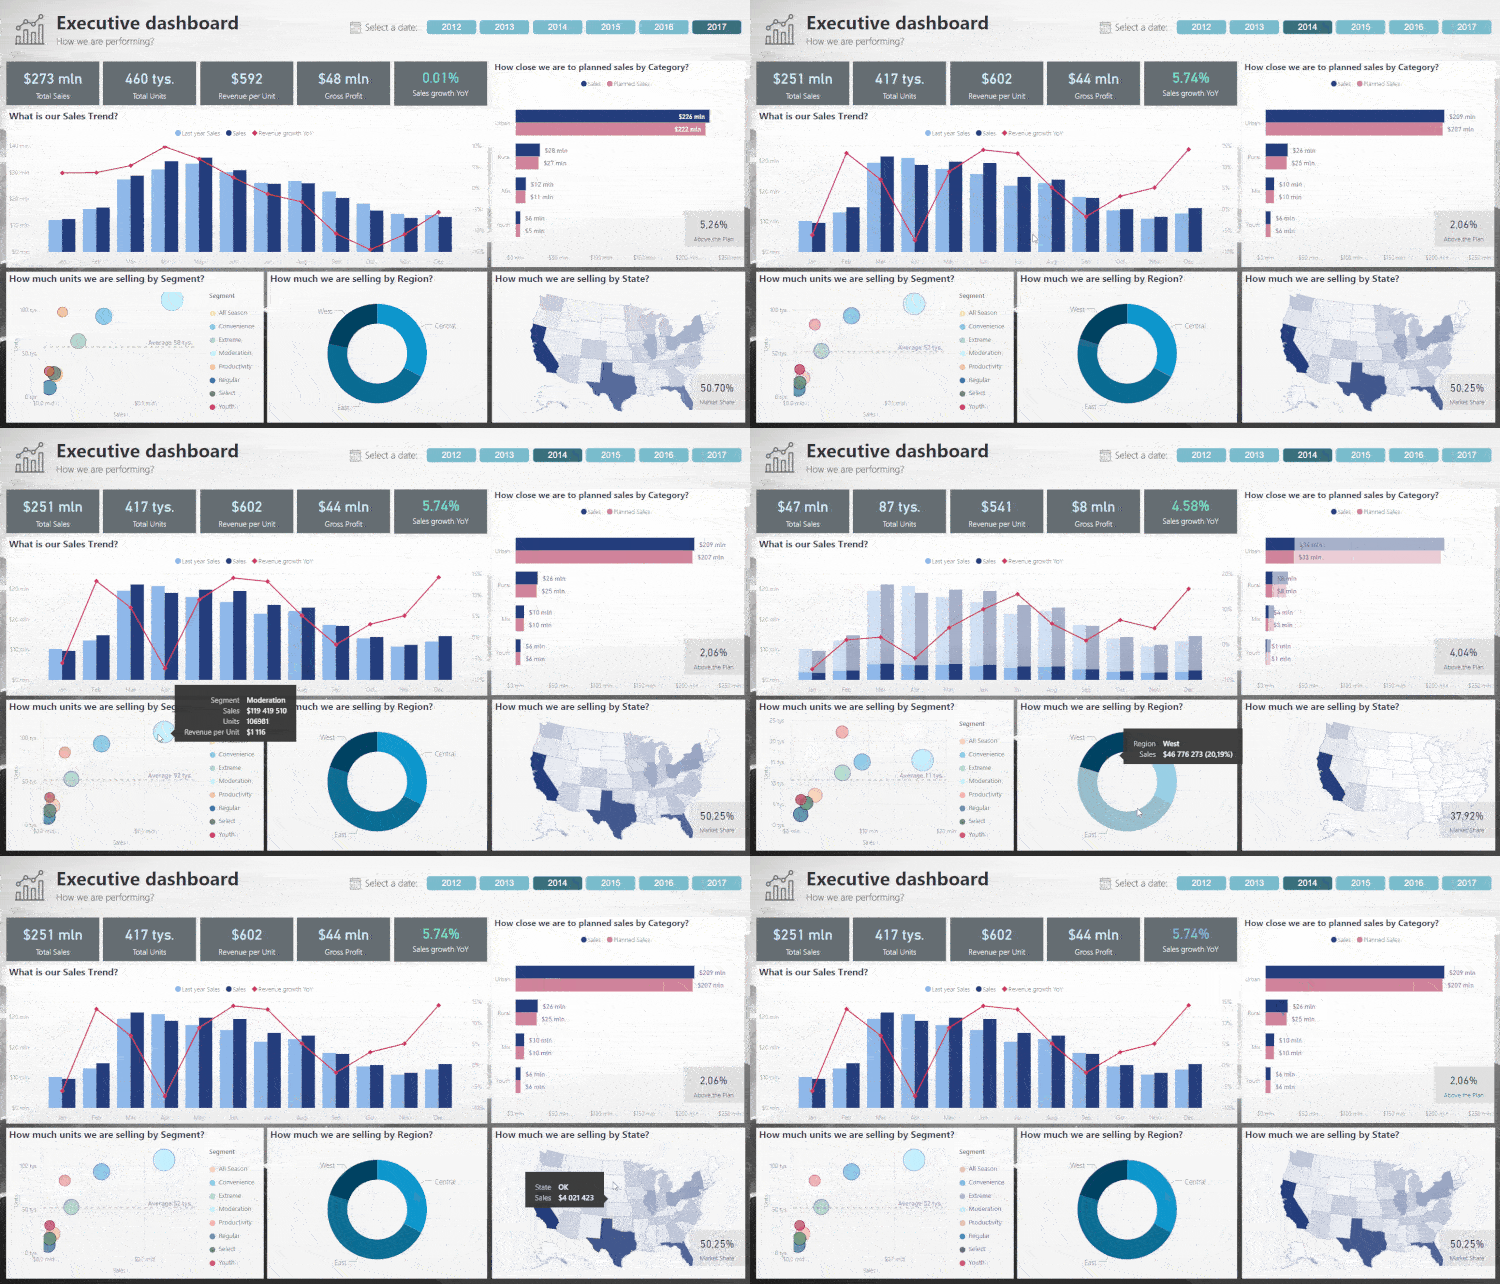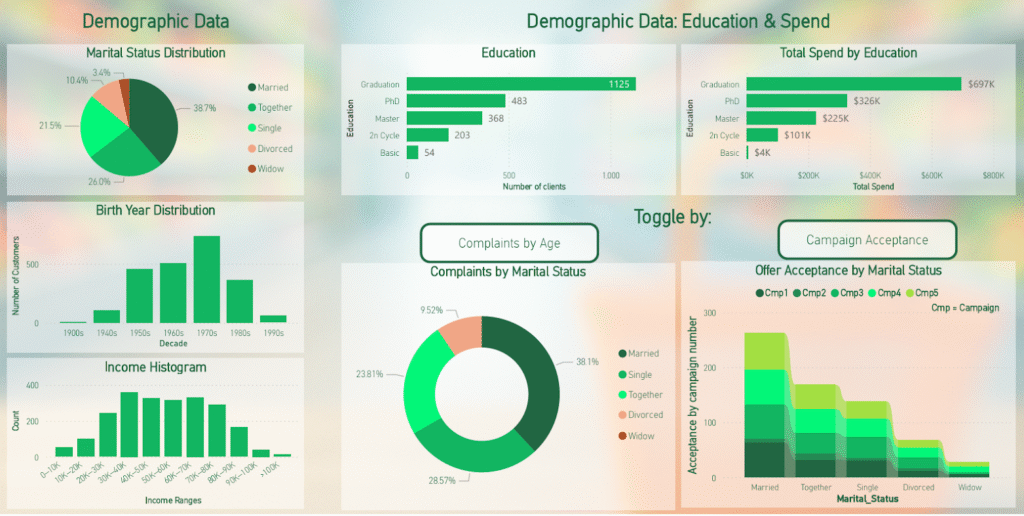
Power BI helps businesses turn raw data into real-time insights for faster, smarter decisions through powerful analytics and visualizations
Whether you’re monitoring sales, customer behavior, or operational efficiency, Power BI dashboards provide a centralized, real-time view of what matters most.
What is Power BI and Why Real-Time Dashboards Matter?
It is a cloud-based business intelligence (BI) tool developed by Microsoft. It allows users to connect to various data sources, transform raw data into interactive reports, and create dashboards that provide a consolidated view of your business metrics.
Why Real-Time Dashboards?
Traditional dashboards update data on a scheduled basis, such as daily or weekly, but real-time dashboards continuously display updated data, reflecting current business conditions. Real-time dashboards allow businesses to:
- Monitor critical Key Performance Indicators (KPIs) instantly
- Detect and resolve operational issues faster
- Make proactive decisions with the latest data
- Improve collaboration through shared insights
- Stay agile in a dynamic market environment
Whether you manage retail operations, healthcare services, finance, or manufacturing, real-time dashboards powered by Power BI offer a competitive advantage.
How to Build Real-Time Business Dashboards With Power BI

Building a real-time dashboard involves several important steps, which are easier to accomplish with Power BI’s intuitive platform.
Step 1: Connect to Data Sources
Power BI supports connections to numerous data sources, including:
- SQL Server, Oracle, MySQL, and other relational databases
- Cloud services like Azure, AWS, and Google BigQuery
- APIs and web services for streaming data
- Excel spreadsheets and CSV files
- Business applications such as Salesforce and Dynamics 365
Pro Tip: If you’re working with cloud platforms, explore our detailed comparison on Azure vs AWS Cloud Platform in 2025 to decide which suits your data needs better.
Step 2: Prepare and Model Your Data
Once connected, it’s critical to clean, transform, and model your data for meaningful insights. Power BI’s Power Query Editor allows users to:
- Filter and sort data
- Merge and append datasets
- Create calculated columns and measures
- Define relationships between tables
Good data modeling ensures your dashboard reflects accurate and useful information.
Step 3: Design Interactive Visualizations
Power BI’s drag-and-drop interface makes it easy to build visually compelling dashboards. Common visual components include:
- Bar, line, and pie charts
- KPI cards highlighting performance metrics
- Maps for geographic data
- Slicers and filters for dynamic exploration
- Tables and matrices for detailed views
These visuals update dynamically as new data streams in, offering an always-current snapshot of your business.
Step 4: Set Up Real-Time Data Refresh
Power BI’s supports several data refresh methods:
- Scheduled refresh: Updates data at set intervals (e.g., every hour)
- DirectQuery: Queries the database live whenever the report is accessed
- Streaming datasets: Push data directly into Power BI in near real-time
- Hybrid approaches: Combine different refresh methods depending on data type
Configuring the appropriate refresh method ensures your dashboard remains timely and relevant.
Step 5: Share and Collaborate
Power BI’s dashboards can be shared securely within your organization or externally with stakeholders. You can:
- Embed dashboards in Microsoft Teams, SharePoint, or web portals
- Set user-specific permissions to control data access
- Use Power BI Mobile to view dashboards on the go
- Automate report subscriptions via email
Effective sharing maximizes the dashboard’s value by enabling better decision-making across teams.
Key Benefits of Using Power BI Real-Time Dashboards

1. Accelerated Decision-Making
Real-time data visualization reduces the time it takes to detect issues or spot opportunities. Whether it’s supply chain bottlenecks or emerging sales trends, Power BI dashboards help you act quickly.
2. Enhanced Business Agility
Continuous monitoring of KPIs allows businesses to adapt strategies on the fly, responding to customer behavior, competitor moves, or market changes effectively.
3. Better Operational Efficiency
Operations managers can track processes in real time, identify inefficiencies, and allocate resources optimally, driving cost savings and productivity improvements.
4. Cross-Departmental Alignment
Dashboards promote transparency and alignment by providing a unified view of metrics, breaking down silos between departments.
5. Scalable Analytics Infrastructure
Power BI’s cloud-based architecture scales with your business. As data volume and complexity grow, It integrates with big data services like Azure Synapse Analytics to handle high workloads seamlessly.
Real-World Applications of Power BI Dashboards

Power BI’s versatility makes it suitable for many industries, such as:
- Retail & E-commerce: Track sales performance, inventory levels, and customer behavior
- Healthcare: Monitor patient outcomes, resource utilization, and compliance metrics
- Finance & Banking: Analyze risk, revenue, and expense data in real time
- Manufacturing: Oversee production lines, quality control, and supply chain status
- Education: Track enrollment trends, student performance, and budget utilization
For more examples, check our scalable software solutions page to see how Power Soft tailors solutions to industry-specific needs.
How Power Soft Can Help You with Power BI
At Power Soft, we offer comprehensive Power BI’s services designed to unlock the full potential of your data:
- Consultation & Strategy: We assess your business goals and data environment to design the ideal dashboard solution.
- Custom Dashboard Development: Our experts build tailored dashboards with interactive visualizations and real-time data integration.
- ETL & Data Pipeline Optimization: We ensure your data flows seamlessly into Power BI using efficient ETL pipelines and cloud integrations.
- Training & Support: We empower your teams to use and maintain Power BI tools effectively.
- Ongoing Maintenance: Continuous monitoring and updates ensure your dashboards stay accurate and up to date.
With over 15 years of experience in custom web applications, cloud integration, and data analytics, Power Soft is your trusted partner in building real-time, data-driven business intelligence solutions.
Useful Resources for Power BI Users
- Microsoft Power BI Official Site
- Power BI Documentation and Tutorials
- Data Refresh in Power BI
- BI Streaming Data
- Power BI Embedded Analytics
Conclusion
Building real-time business dashboards with Power BI is a strategic investment that drives smarter decision-making, boosts operational efficiency, and fuels business growth. By connecting diverse data sources, creating interactive visualizations, and enabling seamless collaboration, Power BI empowers organizations to stay ahead in a competitive landscape.
With Power Soft’s expertise in Power BI, cloud integration, and custom software development, you gain a technology partner committed to helping you harness the power of data.
📧 Email: contact@powersoft.agency
🌐 Website: www.powersoft.agency/services
📞 Call & WhatsApp 1: +1 561-556-0226
📞 Call & WhatsApp 2: +88 01966 773464